Occupation evaluation
The data sent by the Basket, other than assisting the game, is also useful to evaluate the occupation of the Basket itself.
The Occupation evaluation is the process of, given a certain instant in time t, evaluate the probability of the Basket of being occupied o(t).
To evaluate this probability at t, we use the measurements as an input (i.e. AccelerometerData, BasketData and PeopleDetectedData) in the neighborhood of t. Every measurement gives a contribution to the occupation probability that becomes lower as the event gets older. As a result, if many events happen at the same time, o(t) will result higher and if the basket hasn’t sent measurements for a while o(t) will be lower and eventually zero.
Modelling of the probability contribution
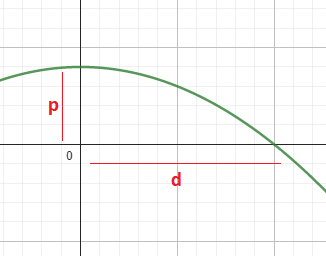
We therefore need a way to model the probability contribution produced by a single measurement. The idea is that a measurement happening at a certain instant t0 will raise the occupation probability of p and will gradually vanish until reaching zero after a period of d.
For example, the Basket data should give a high probability contribute to the final occupation probability since if something occludes the IR detector it’s very probable that it’s the ball and that there’s someone playing. For this reason, the current setup for the BasketData measurement is p = 0.04 and d = 20 minutes. Which means: an increase of 0.04 when the event is received and of 0 after 20 minutes.
We’ve decided to model the probability contribution function as a negative parable of the equation:


dt is the difference between the t time at which the occupation has to be evaluated and t0 which is the time when the measurement happened. Both dtand d are measured in seconds.
It’s engineer’s task to tune the p and d parameter for every measurement in order to obtain a suitable o(t) function.
Visualization on fake measurements
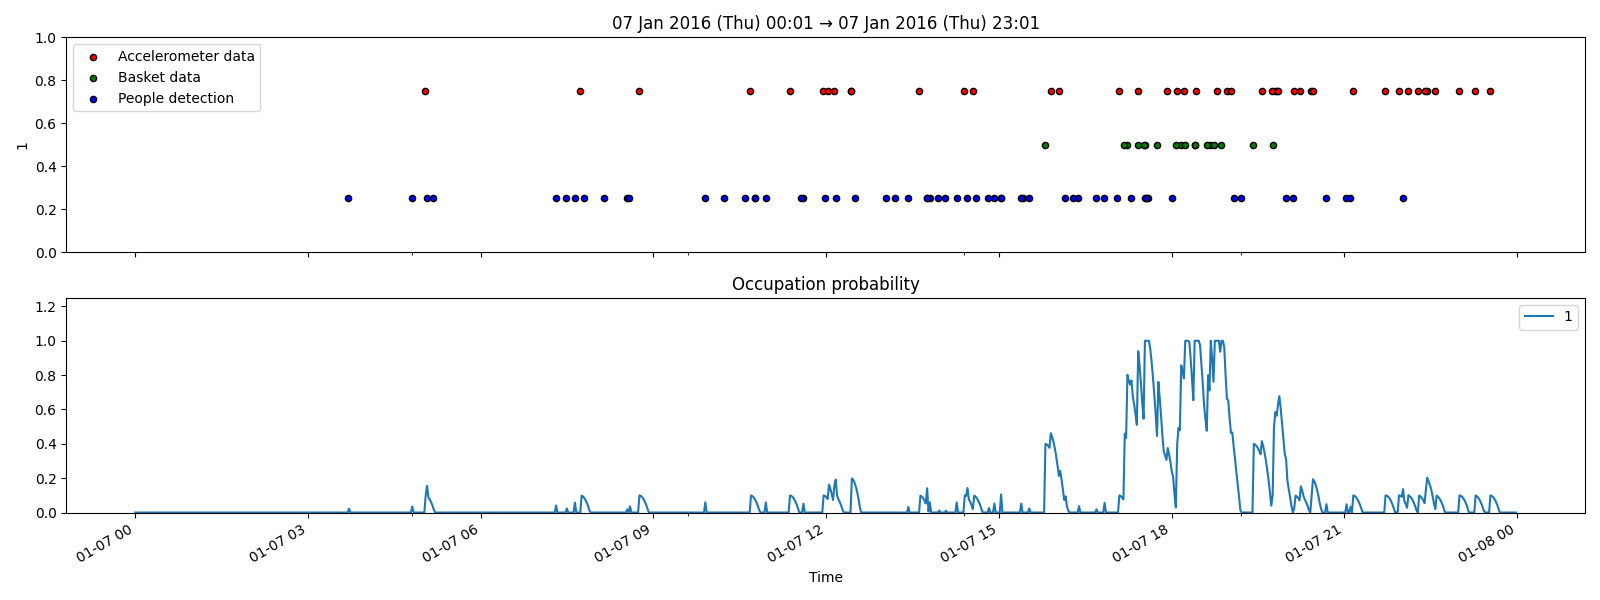
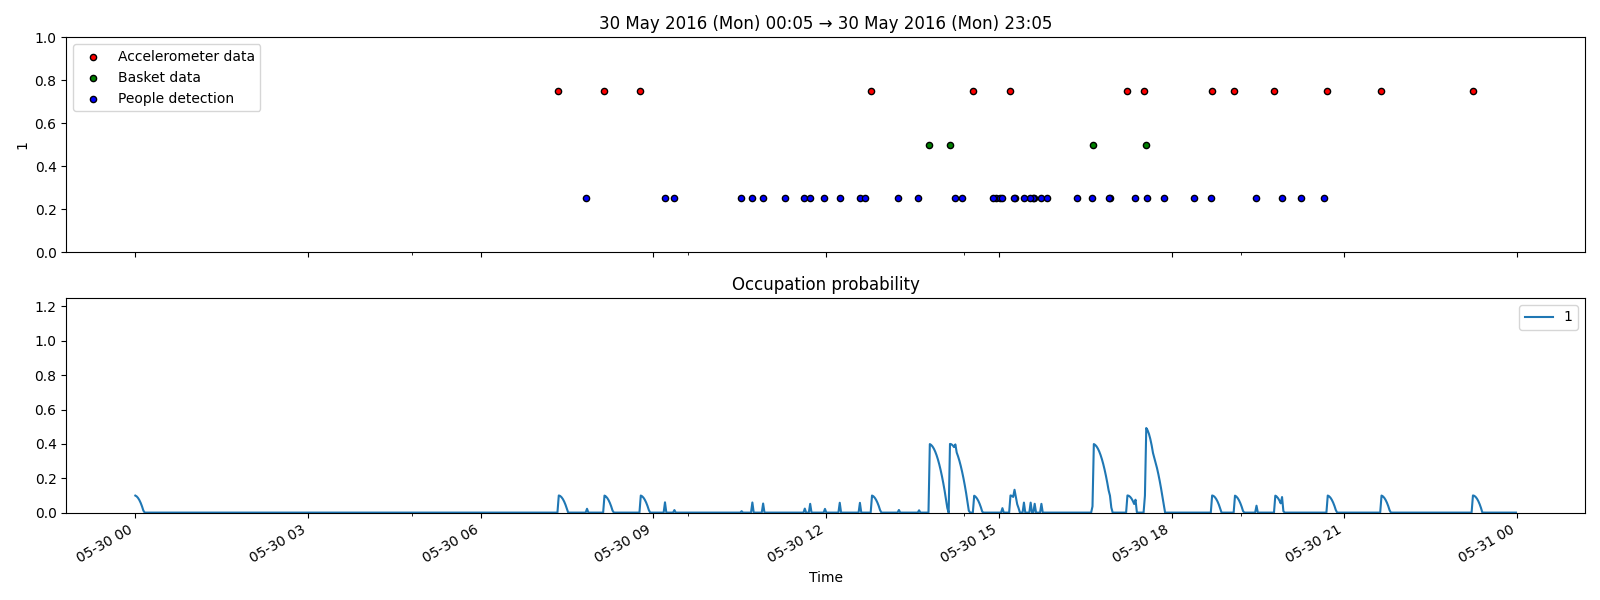
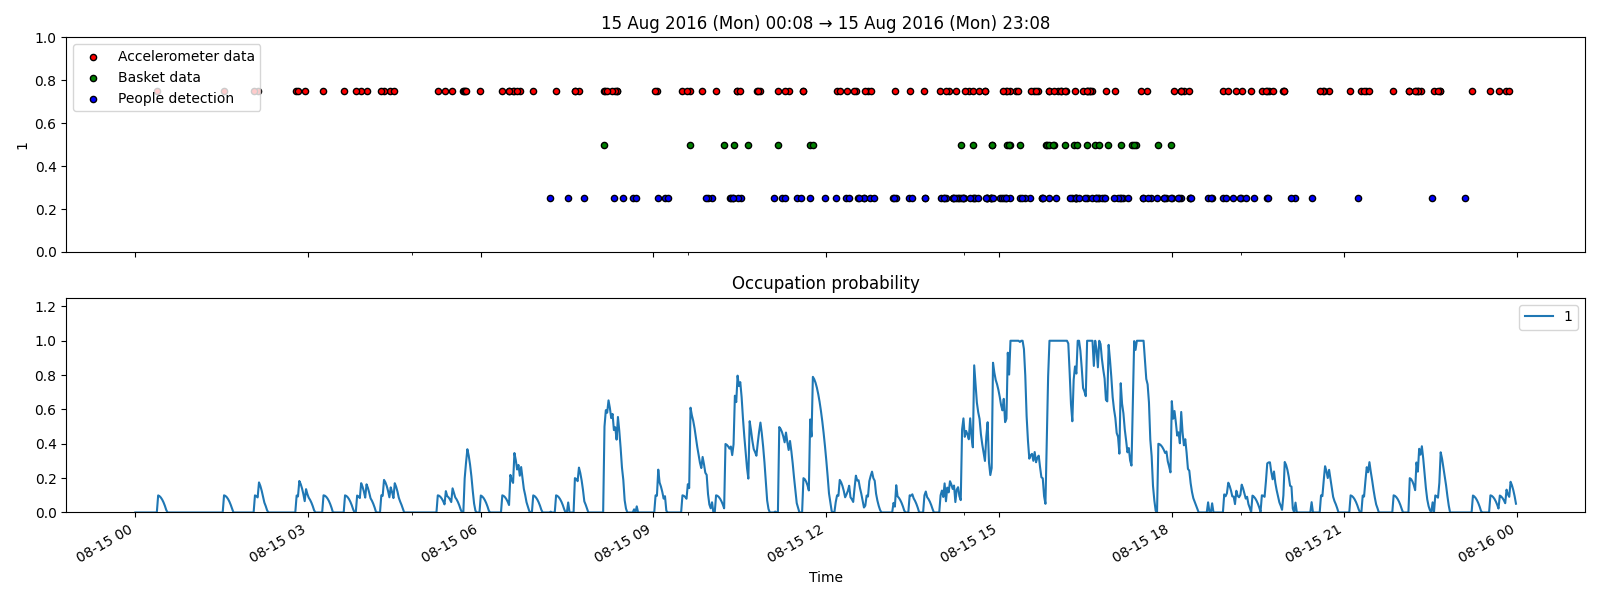
The occupation probability function has been tuned and visualized on fake measurements generated by the SampleDataGenerator. Here are some examples:


